Oct, 2023: Engineering at Rewaa decided to improve the page load performance of its Platform Webapp. Of the many performance metrics available to us, we prioritized improving Time to First Byte (TTFB).
TTFB measures the duration from the user or client making an HTTP request to the first byte of the page being received by the client’s browser. – Wikipedia
Why TTFB?
One might argue, why optimize TTFB ahead of user centric metrics like LCP and FCP? To answer this, we have to understand the significance of optimizing TTFB when serving Single Page Applications (SPAs).
A Single Page Application (SPA) has to deliver the index.html file to the browser first. The index.html file then requests for more files (css,js,fonts) which execute and render meaningful content for the user. The sooner the index.html is delivered to the browser, the quicker user centric content can start rendering. This is why TTFB is crucial when serving SPAs.
With the case established for optimizing TTFB, we decided to punch above our waist and set our target to reduce TTFB to less than 500ms.
What is a good TTFB score?
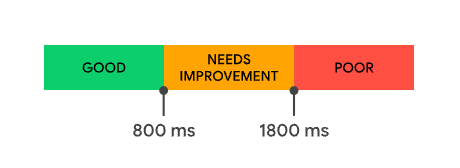
The quicker, the better. However it is understood that anything below 800ms is good.
Measuring TTFB
“You cannot improve what you don’t measure”.
You can measure TTFB by:
- Network Tab of the browser
- Performance analysis through Lighthouse (or a similar tool)
It is important to understand that TTFB depends on many factors resulting in different measures for each user. Measuring a 75th percentile of Average TTFB across all users was more meaningful to track as compared to single user values provided by the options mentioned above. I was able to setup the graph using Real User Monitoring (RUM) on Datadog.

The numbers proved we were not Poor but not Good either.
… we decided to punch above our waist and set our target to reduce TTFB to less than
500ms.
Current Content Delivery Setup
Our Platform Webapp is a Single Page Application built with Angular, being served from Mumbai through AWS CloudFront. SPAs require a specific kind of routing where each registered route within the application should return the index.html file. Our current setup on CloudFront was doing that but in a strange way. Each registered route resulted in a Http 404, which we intercepted and returned the index.html file along with it.
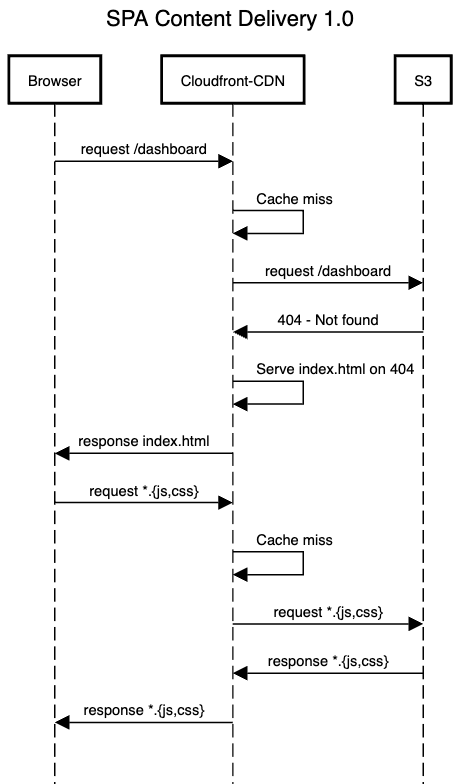
Limitations of the current Content Delivery setup
I realized there are several problems with our setup:
All initial page loads were 404s with
index.html: It works but it has its side effects which maybe unknown. One such example is, running “Lighthouse” page load performance refuses to compute results becauseindex.htmlhas a404 - Not Foundstatus.All requests were resulting in a cache miss: Each cache miss resulted in content being delivered directly from the origin. No advantage was being taken from the intermediate caches. Mumbai (our primary region) was serving the entire world irrespective of distance.
Solutions
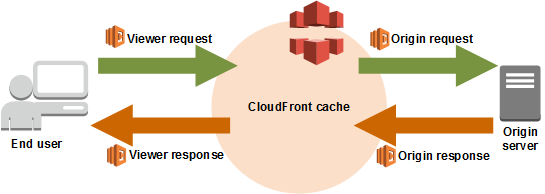
The lifecycle events illustrated below forms the foundations of all the performance gains, so pay close attention to it.
Routing fix
The first step was to get rid of the 404s by returning the index.html file on all routes without an extension (png,css,woff). Lambda@Edge, which is a specific kind of lambda function has the ability to execute code before the request reaches CloudFront.
The ability to intercept a request before it reaches CloudFront Cache i.e. Viewer Request is all I needed. In the following few lines, I was able to rewrite the incoming requests to index.html.
1
2
3
4
5
6
7
8
9
10
11
export const handler = async (event, context, callback) => {
  const { request } = event.Records[0].cf;

  const re = /(?:\.([^.]+))?$/;

  if (!re.exec(request.uri)[1]) {
    const newuri = request.uri.replace(/.*/, '/index.html');
    request.uri = newuri;
  }
  callback(null, request);
};
With Lambda@Edge setup to execute at Viewer Request, I just removed the Custom error response from Error pages to rid the setup for 404 intercepts.
Caching fix
The next target was to minimize the cache miss illustrated in the diagrams above. To cache content, the CDN looks for the Cache-Control headers. The Cache-Control header in our app was set to no-cache, no-store, must-revalidate. Let’s break this down:
no-cache: This does not mean “don’t cache”. Cache will always revalidate content from the source before serving.no-store: No content would be stored in any cache.must-revalidate: Response will be reused while fresh. Response will be validated once stale.
The no-store not allowing anything to be stored made the no-cache and must-revalidate directives practically useless. Worth mentioning that must-revalidate always should be used with max-age to help the cache identify fresh content. In short, the configuration was completely broken.
By setting Cache-Control header to must-revalidate max-age=604800, CloudFront served the cached responses until a reasonable amount of time (7 days) has passed or there is new content available. Setting the correct cache headers also enabled ETag on each request resulting in a Http 304 Not Modified if the content did not change. For new releases, we programmatically invalidated all CloudFront caches to ensure the new release always results in fresh content for our users.
Icing on the cake - CloudFront Functions
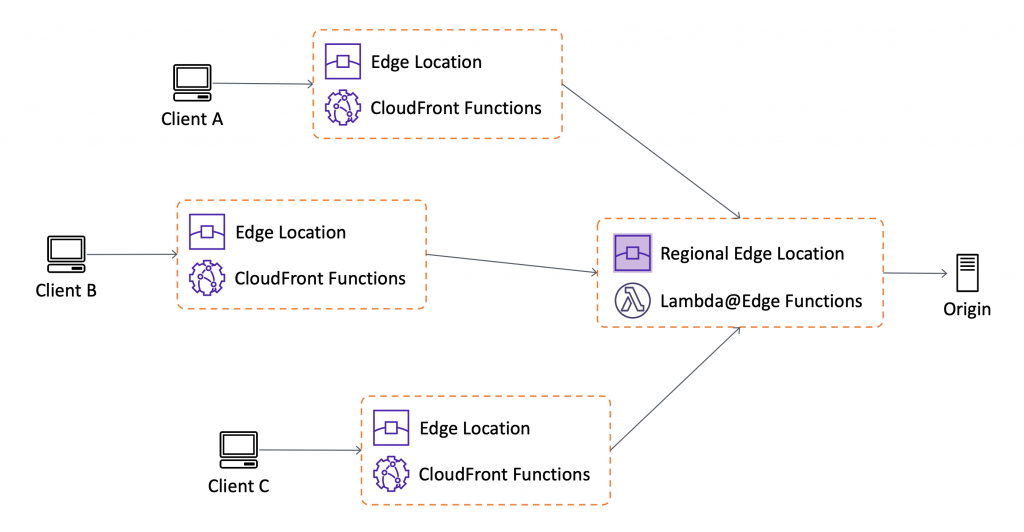
While monitoring the logs I noticed that all content is being served from Frankfurt. With most of our customer base in Saudi Arabia, not serving content from Mumbai (our deployment region) was definitely a win. I wondered if there were still a few more millisecond I could reduce by serving from an Edge Location instead of a Regional Edge Cache.
tl;dr
Edge Locationserves content with reduced latency because it is nearer to the users as compared to theRegional Edge Cache.
The reason why all our content was being served from Frankfurt is because Lambda@Edge executes only on the Regional Edge Cache. Since our routing logic was simple, moving it to CloudFront Functions (Event source: Viewer Request) was the better choice. A clear reduction of approx. 100ms was noticed by moving from Lambda@Edge to CloudFront Functions You can find all the difference between Lambda@Edge and CloudFront Functions at this link.
Bonus Discovery along the way
Lighthouse also indicated that served content is uncompressed resulting in high volumes of data transfer. Enabling GZip compression can reduce the data transfer volume up by 75%. Enabling GZip only required setting the CacheOptimized policy under Behaviors of the CloudFront distribution.
Results
I recorded the TTFB numbers from 4PM to 9AM (the next day) for 3 consecutive weekdays to test the hypothesis. Here are the results:
| Function | Avg. TTFB (75pc) |
| No function | 987.45ms |
| Lambda@Edge | 490.34ms |
| CloudFront Functions | 401.46ms |
And here are the numbers for the amount of data transferred for 2 consecutive months:
| Dates | Data Transferred |
| 25th Oct - 24th Nov | 9.49 GB |
| 25th Nov - 25th Dec | 2.02 GB |
And our final content delivery setup became:
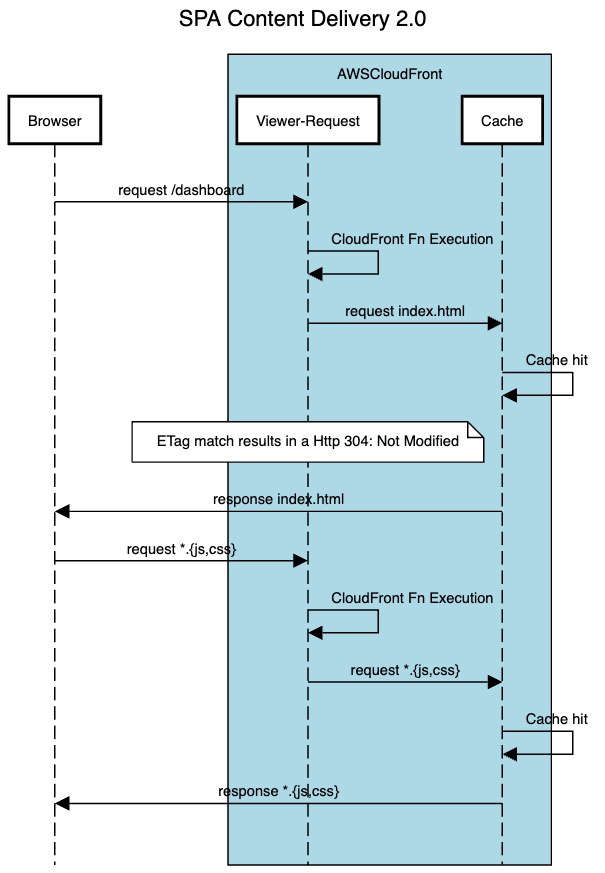
Overall, the results came out to be just fantastic. The 75pc of TTFB was reduced by 50% and the Total Data Transfer was reduced by 75% on average. Target of reducing TTFB to less than 500ms was successfully achieved.